Bài mẫu IELTS Writing Task 1 là một trong những bộ tài liệu được học viên IELTS tìm kiếm nhiều nhất. Cùng Edmicro tìm hiểu các bài mẫu IELTS Writing task 1 đầy đủ và mới nhất nhé!
Cấu trúc phần thi IELTS Writing
Để tham khảo và luyện tập qua các bài mẫu IELTS Writing Task 1, thí sinh trước hết cần nắm rõ cấu trúc của phần thi Writing. Bài thi này kéo dài 60 phút, gồm 2 task với yêu cầu và thang điểm khác nhau.
Task 1: Thí sinh cần viết tối thiểu 150 từ trong khoảng 20 phút. Ở dạng Academic, đề bài thường yêu cầu mô tả, so sánh số liệu từ biểu đồ, bảng, sơ đồ hoặc quy trình. Trong khi đó, với General Training, thí sinh sẽ viết một bức thư (formal, semi-formal hoặc informal) dựa trên tình huống thực tế. Các bài mẫu IELTS Writing Task 1 thường giúp thí sinh học cách phân tích số liệu, chọn lọc thông tin quan trọng và trình bày mạch lạc.
Task 2: Yêu cầu viết một bài luận tối thiểu 250 từ trong vòng 40 phút, xoay quanh một vấn đề xã hội hoặc quan điểm cá nhân. Đây là phần chiếm số điểm cao hơn, nên thí sinh cần lập luận chặt chẽ và có ví dụ minh họa.
Việc hiểu rõ cấu trúc và luyện tập với bài mẫu IELTS Writing Task 1 sẽ giúp thí sinh xây dựng nền tảng vững chắc, từ đó cải thiện khả năng viết và đạt điểm số cao.
Bài mẫu IELTS Writing task 1
MAP (Bản đồ)
MAP IELTS writing Task 1 là dạng bài yêu cầu nhận xét về sự thay đổi của bản đồ qua thời gian nhất định. Bài MAP yêu cầu bạn phải tìm và chỉ ra những điểm giống và khác nhau giữa các bản đồ. Cũng như sự thay đổi, phát triển hoặc thụt lùi của khu vực đó qua từng năm.
Bài mẫu IELTS Writing Task 1 MAP
The maps below show the changes in a town after the construction of a hydroelectric power dam.
Summarize the information by selecting and reporting the main features and make comparisons where relevant.
You should write at least 150 words.
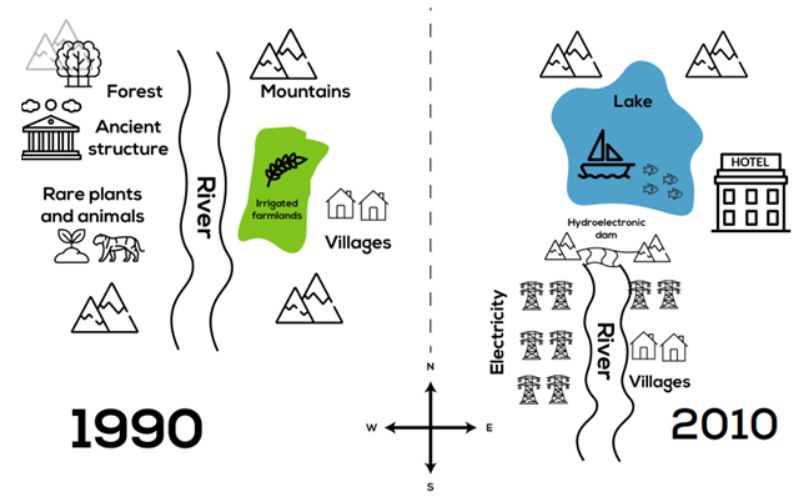
The map depicts significant transformations that occurred in a town following the construction of a hydroelectric power dam. Overall, it is evident from the map that the most prominent change was the creation of a vast lake. Additionally, the once-present forest and farmlands had completely vanished by the year 2010.
In 1990, the area west of the river featured an ancient structure and a forest that housed rare flora and fauna. To the east, there were irrigated farmlands. However, with the construction of the dam wall, all these features were submerged beneath the expansive lake, which also doubled as a fishing area by 2010.
Upon closer examination of the maps, while the mountains remained unchanged, the villages in the far east were relocated further south, making way for the construction of a large hotel. Simultaneously, a hydroelectric power dam was erected, accompanied by the installation of numerous electricity pylons in the vicinity.
Lưu ý làm bài IELTS Writing Task 1 – MAP
Khi làm IELTS Writing Task 1 dạng bài Map. Bạn cần lưu ý một số điều sau để bài viết có kết quả cao nhất:
- What appears or disappears (xuất hiện và biến mất): chú ý xem điều gì xuất hiện thêm hoặc biến mất giữa 2 bản đồ.
- Increase or decrease in size (tăng hoặc giảm): Sự tăng hoặc giảm về mặt kích thước.
- Change (thay đổi): bạn nên lưu ý những thay đổi về tên, vị trí, hoặc chức năng của các địa điểm, vật thể trong map.
Khi làm bài, hãy để ý đến toàn bộ tổng thể chung từ trái sang phải và từ trên xuống dưới. Hãy đưa sự thay đổi lớn nhất và dễ nhận ra nhất vào đầu bài viết của bạn.
LINE GRAPH (Biểu đồ đường)
Line graph là dạng bài thường gặp nhất của bài thi IELTS Writing Task 1. Dạng bài này thể hiện xu hướng biến đổi theo thời gian.
Bài mẫu IELTS Writing Task 1 LINE GRAPH
The line graph below shows the oil production and consumption in China between 1982 and 2006.
Summarize the information by selecting and reporting the main features and make comparisons where relevant.
You should write at least 150 words.
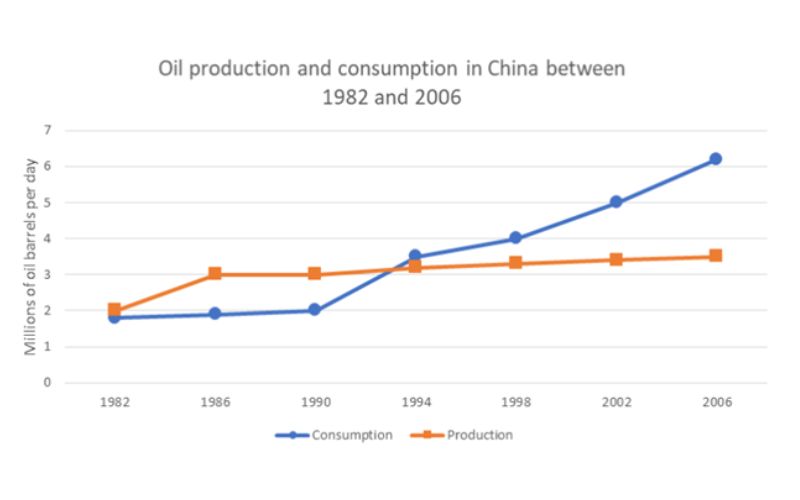
The graph provides a comprehensive overview of China’s daily oil production and consumption over a 24-year period, commencing in 1982. Overall, both oil production and consumption experienced growth during this time frame, although oil consumption showed a notably steeper increase.
In 1982, China’s daily oil production and consumption were nearly identical, hovering around 2 million barrels per day. Subsequently, while oil consumption only exhibited a modest rise over the following eight years, reaching approximately 2 million barrels per day by 1990, oil production demonstrated significant growth, peaking at 3 million barrels per day in 1986 and maintaining that level until 1990.
Starting in 1990, the daily oil consumption rate showed a consistent upward trend, ultimately surpassing 6 million barrels. In contrast, daily oil production also saw an increase after 1990, but the growth was comparatively minor, culminating at roughly 3.5 million barrels per day in 2006. Notably, this production figure fell significantly short of the country’s consumption rate.
Lưu ý làm bài IELTS Writing Task 1 – LINE GRAPH
Dù là một dạng bài đơn giản, nhưng bạn cũng cần xem xem mình đã nắm được những lưu ý sau khi làm bài hay chưa:
- Nên sử dụng thì quá khứ đơn với những sự kiện đã xảy ra. Hầu hết các biểu đồ đường đều thể hiện xu hướng của quá khứ tới hiện tại.
- Không nên sử dụng các thì phức tạp như quá khứ hoàn thành hay câu bị động. Điều này sẽ làm phức tạp hóa bài viết, không được giám khảo đánh giá cao.
- Chỉ cần tập trung mô tả xu hướng chung, không cần đi vào chi tiết so sánh từng năm một. Chỉ ra overall changes (thay đổi tổng thể), highest (cao nhất), lowest (thấp nhất).
Line graph là dạng bài cơ bản của IELTS Writing, nhưng vẫn có những lưu ý nhất định. Hãy nhớ để ý những gợi ý trên để bài viết của bạn được đánh giá cao nhé.
TABLE (Bảng)
Dạng bài Table cần bạn đặc biệt lưu ý đến những thay đổi giữa các con số. Cùng Edmicro tìm hiểu bài mẫu IELTS Writing Task 1 dạng bài Table (Bảng).
Bài mẫu IELTS Writing Task 1 TABLE
The table shows the number of employees and factories producing silk in England and Wales between 1851 and 1901.
Summarize the information by selecting and reporting the main features and make comparisons where relevant.
You should write at least 150 words.
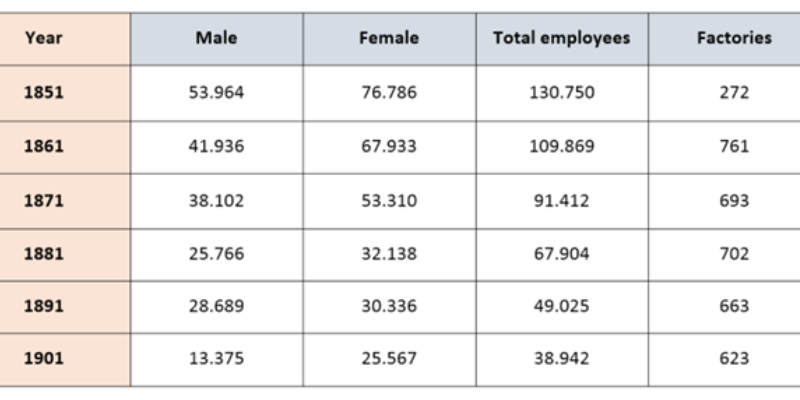
The table presents data on the workforce involved in silk production in England and Wales spanning a half-century, starting from 1851. Overall, there was a consistent decline in the total number of individuals employed in the silk industry in both countries throughout the 50-year period. Interestingly, the majority of workers in this industry were women. The number of silk factories showed fluctuations but ended up higher than its starting point.
In 1851, the peak year for the silk workforce, there were a total of 130,750 employees, with females constituting the larger share at 76,786, while males numbered approximately 54,000. Surprisingly, the number of silk factories was at its lowest in that year, with only 272 establishments.
Ten years later, in 1861, the number of silk factories nearly tripled, reaching 761, while the total workforce dropped significantly, losing over 20,000 employees.
Over the subsequent four decades, both the male and female workforce steadily decreased, reaching 25,567 and 13,375 respectively by 1901. This decline led to a reduction in the total workforce, which amounted to 38,942 individuals in 1901. Concurrently, the number of silk factories followed a fluctuating trend but ended up slightly lower at 623 in 1901, compared to 761 in 1861.
Lưu ý làm bài IELTS Writing Task 1 TABLE
Với dạng bài TABLE, người học cần lưu ý một vài điểm như sau:
- Nên chọn lọc ra những con số lớn nhất và nhỏ nhất. Sau đó tiến hành so sánh.
- Sử dụng thì quá khứ đơn cho số liệu của năm cũ và tương lai đơn cho số liệu dự đoán của tương lai. Nếu không có mốc thời gian cụ thể, sử dụng thì hiện tại đơn.
- Nên so sánh trong cùng cột và hàng thay vì đi so sánh từng ô riêng lẻ.
PROCESS (Quy trình)
Dạng bài Process (quy trình) thể hiện quy trình và các bước thực hiện một công việc nào đó. Bạn có thể tham khảo bài mẫu IELTS Writing Task 1 Process dưới đây.
Bài mẫu IELTS Writing Task 1 PROCESS (Quy trình)
The diagram below shows how orange juice is produced.
Summarize the information by selecting and reporting the main features and make comparisons where relevant.
You should write at least 150 words.
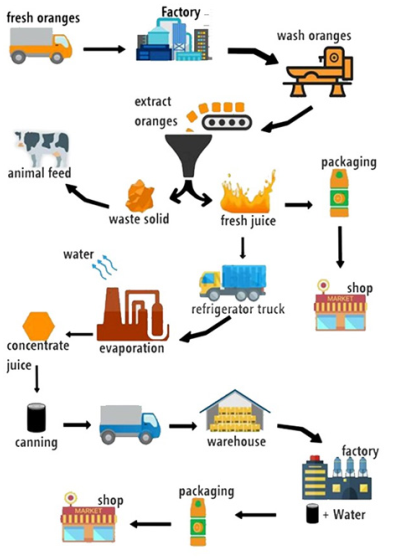
The diagram illustrates the production of orange juice. Overall, there are various stages involved, beginning with the collection of fresh oranges and culminating in the distribution of packaged juice to supermarkets.
Initially, ripe oranges are harvested, loaded onto trucks, and transported to a processing plant. At the plant, the oranges undergo a thorough washing process by a machine to ensure cleanliness. Subsequently, a squeezing machine extracts the juice from the oranges, while any solid waste, such as peels and seeds, is collected and repurposed as animal feed.
The freshly squeezed juice can follow two different paths. It can be directly packaged and sent to supermarkets for sale. Alternatively, it may be transported to another facility for an evaporation process. During this step, an evaporator machine removes the water content from the fresh orange juice, resulting in concentrated juice. This concentrated juice is then canned and stored in a warehouse. Later, it is mixed with water, packaged once more, and distributed to supermarkets for consumers to purchase.
Lưu ý làm bài IELTS Writing Task 1 PROCESS (Quy Trình)
Đối với dạng bài PROCESS (quy trình), thí sinh cần lưu ý những điểm sau khi làm bài:
- Cần tóm tắt ngắn gọn được các quy trình diễn ra. Bài viết của bạn cần có điểm bắt đầu và kết thúc.
- Nên dùng từ nối để dẫn dắt người đọc qua từng bước của quy trình. Ví dụ như: First, next, at the final process…
- Nếu bài viết không đề cập thời gian cụ thể thì chỉ nên sử dụng thì hiện tại đơn.
BAR CHART (Biểu đồ cột)
Dạng bài bar chart (biểu đồ cột) được sử dụng để so sánh số liệu theo từng năm. Bạn có thể tham khảo bài mẫu IELTS Writing task 1 BAR CHART của Edmicro dưới đây.
Bài mẫu IELTS Writing Task 1 BAR CHART (Biểu đồ cột)
The bar chart shows the percentage of people going to cinemas in one European country on different days.
Summarize the information by selecting and reporting the main features and make comparisons where relevant.
You should write at least 150 words.
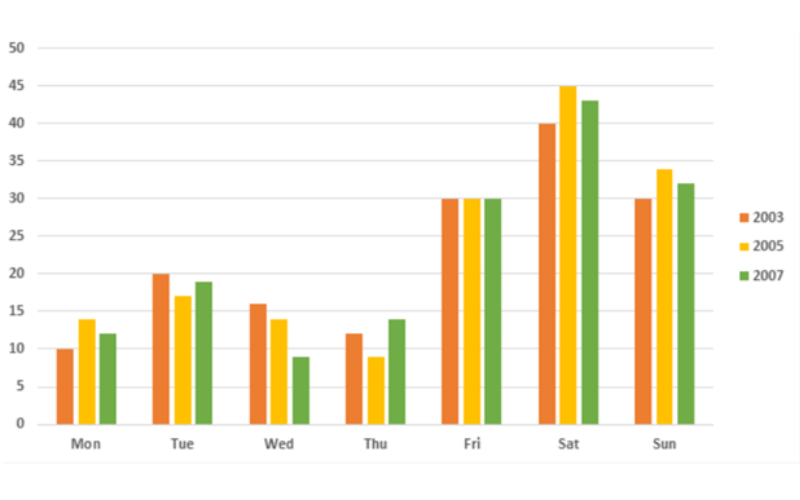
The chart presents data on the percentage of people visiting a cinema in a European nation throughout the years 2003 to 2007, categorized by the days of the week. Overall, there were minor fluctuations in the cinema attendance patterns during this period, with weekends being the preferred time for cinema visits compared to weekdays.
In 2003, the highest proportion of cinema-goers, accounting for 40%, chose to visit on Saturdays. Fridays and Sundays had equal shares, with 30% each. In contrast, the early weekdays saw lower numbers, with Tuesday at 20% and Monday being the least popular at only 10%.
Over the following four years, there was a slight increase in the preference for weekend visits, with 45% of people choosing Saturday and 35% opting for Sunday in 2007. Additionally, Thursday and Monday witnessed a modest rise in cinema-goers, both with an increase of about 2%. However, Tuesday and Wednesday experienced a decrease, with figures dropping to 19% and 9%, respectively. Remarkably, Fridays consistently attracted 30% of movie-goers throughout the examined period.
Lưu ý làm bài IELTS Writing Task 1 BAR CHART (Biểu đồ cột)
Đối với dạng bài BAR CHART (Biểu đồ cột), thí sinh cần lưu ý những điểm sau khi bắt đầu làm bài:
- Để ý đến các đối tượng, địa điểm, và thời gian.
- Nếu không có sự đề cập thời gian cụ thể nào khác, bạn nên sử dụng thì quá khứ đơn với writing task 1 dạng bar chart.
- Cần nêu ra được những gì nổi bật nhất, như số liệu cao nhất, hoặc thấp nhất.
Xem thêm: Improve Your IELTS Writing Skills PDF Tải Miễn Phí & Review Chi Tiết
PIE CHART (Biểu đồ tròn)
Ngoài Table, Line Graph và Bar Chart, Pie Chart (biểu đồ tròn) cũng là dạng bài quen thuộc nhất của IELTS Writing Task 1. Hãy cùng Edmicro tìm hiểu bài mẫu cho dạng biểu đồ này:
Bài mẫu IELTS Writing Task 1 PIE CHART (Biểu đồ tròn)
The charts below show the percentage of people aged 23-65 in different occupations in one UK town (Ashby) and in the UK as a whole in 2008.
Summarize the information by selecting and reporting the main features and make comparisons where relevant.
You should write at least 150 words.
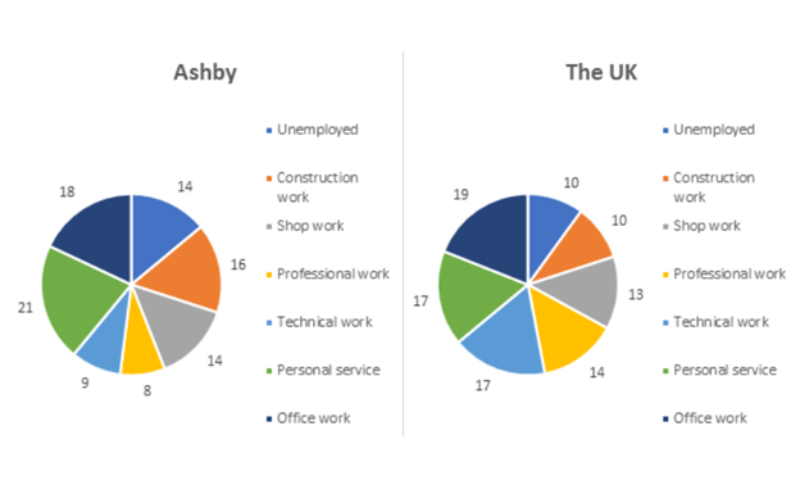
The pie charts present a comparison of employment statuses among individuals aged 23 to 65 in Ashby and the UK in the year 2008. Overall, the national unemployment rate was lower than that of Ashby, with distinctions in the preferred professions between the two regions.
Ashby exhibited a higher unemployment rate, with 14% of its population without employment, in contrast to the national rate of only 10%. The distribution of employment in office work and shop work in Ashby closely resembled that of the entire UK, at 18% and 14% respectively, mirroring the national percentages of 19% and 13% for these categories.
Interestingly, the UK had a notably larger workforce in technical occupations, constituting 17% of the population, while in Ashby, this category accounted for just 9% of the workforce, approximately half of the UK figure. Conversely, Ashby had a higher representation of construction workers and personal service providers, at 16% and 21% respectively, exceeding the UK’s 10% and 17% for these roles. Lastly, in terms of professional occupations, 8% of Ashby’s residents were engaged in such work, in contrast to 14% of the overall UK population.
Lưu ý làm bài IELTS Writing Task 1 PIE CHART (Biểu đồ tròn)
Đối với dạng bài BAR CHART (Biểu đồ cột), thí sinh cần lưu ý những điểm sau khi bắt đầu làm bài:
- Một bài phân tích Pie Chart nên bao gồm 4 đoạn. Bạn nên đi từ Introduction, sau đó là 2 đoạn phân tích chi tiết (Details) và kết bài (conclusion).
- Trong 2 đoạn phân tích chi tiết, bạn có thể phân tích theo đối tượng hoặc theo từng năm.
- Nên lưu ý đến các mốc thời gian, đối tượng và số liệu.
XEM THÊM: Tự Học IELTS Writing: Hướng Dẫn Siêu Chi Tiết – Cực Dễ Áp Dụng
MIXED CHARTS (Biểu đồ kết hợp)
Dạng bài mixed charts (biểu đồ kết hợp) là dạng bài khó. Tần suất bạn gặp phải dạng bài này khi đi thi cũng không quá cao. Mixed charts là sự kết hợp giữa hai trong các loại biểu đồ cột, bảng, biểu đồ đường, và biểu đồ tròn. Dưới đây là một bài mẫu IELTS Writing Task 1 Mixed charts.
Bài mẫu IELTS Writing Task 1 MIXED CHART (Biểu đồ kết hợp)
The chart below gives information about the high speed continuous internet connection of households in five countries in 2001 and 2002.
Summarize the information by selecting and reporting the main features and make comparisons where relevant.
You should write at least 150 words.
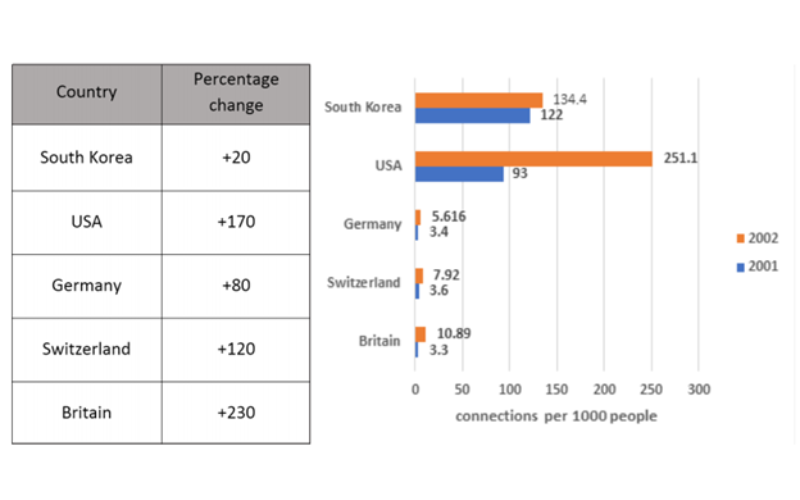
The bar chart and table provide a comparison of five countries concerning the percentage of families with high-speed internet access and the changes observed over two consecutive years, spanning from 2001 to 2002. Overall, South Korea and the USA led in terms of the proportion of families with high-speed internet access during these years. Notably, the most significant change in the number of families gaining high-speed internet access occurred in Britain.
In 2001, approximately 11.2% of South Korean households enjoyed high-speed internet access, while 9.3% of US families had similar access. One year later, the USA experienced a remarkable 170% surge in the number of families with high-speed internet, reaching a peak of 25.11% among all the countries analyzed during this period. In contrast, South Korea’s growth was relatively modest at only 20%.
High-speed internet access was less common in Germany, Switzerland, and Britain, with approximately 0.35% of households in these countries having such access. However, all three nations witnessed substantial increases in high-speed internet connections over the year, with Germany and Switzerland experiencing growth rates of 80% and 120%, respectively. Meanwhile, Britain showed the most substantial increase in high-speed internet connections, with a remarkable growth rate of 230%.
Lưu ý làm bài IELTS Writing Task 1 MIXED CHART (Biểu đồ kết hợp)
Vì đây là dạng bài khó, nên bạn cần đặc biệt để ý đến những điều này khi viết bài:
- Vì đề bài có 2 biểu đồ, nên lượng thông tin cũng lớn. Bạn không nên ôm đồm hết tất cả mà chỉ chọn ra những thông tin quan trọng và nổi bật nhất.
- Nên chú ý phân tích điểm đầu và điểm cuối, cũng như số liệu cao nhất và thấp nhất.
- Nên nắm rõ đặc trưng của từng dạng biểu đồ và lựa chọn phương pháp phân tích phù hợp nhất.
Mixed Chart là sự kết hợp của hai biểu đồ nên lượng thông tin tương đối nhiều. Thêm vào đó, bạn sẽ cần lồng ghép phân tích của hai loại biểu đồ khác nhau. Đây là dạng bài khó, đòi hỏi phải đặc biệt nắm chắc từng loại biểu đồ của IELTS Writing Task 1.
Trên đây là tổng hợp toàn bộ bài mẫu IELTS Writing Task 1 cho 7 dạng biểu đồ khác nhau. Nếu còn gì không hiểu về Writing, đừng ngại liên hệ Edmicro để được giải đáp nhanh nhất nhé!
Xem thêm:


